MORE
Data & Analytics
Every interaction & event, analysed.
View individual learner metrics easily, each session also includes a video of the session so you can review it. Statistics are aggregated so you can track organisation wide progress from your dashboard.
Create an experience

Individual session records
Each VR session becomes an experience record.
The moment the user begins their learning journey in VR to the moment they complete their session, detailed analytics are aggregated. Dynamic charts are created for you so you can easily gain insight into a users’ session.
Each experience record is split into 3 primary sections. The overall metrics section, the detailed audit log and the session recordings section.
View sections
Session Metrics
The session metrics provide an overview of the learners session, with important data surfaced in dynamic charts. The surfaced data relates to the content of the users session.

Audit Log
An audit log provides a detailed, time-stamped record of every action taken during a training session. This creates a clear, objective trail for verifying performance, ensuring compliance, and resolving disputes. Trainers can analyse specific decisions, measure reaction times, and track improvements across multiple sessions, while organisations gain reliable documentation to support safety standards and regulatory requirements.

Video Recordings
Session videos allow learners to replay their experience, reflect on their actions, and identify ways to improve. Trainers gain an objective record of performance, making it easier to provide precise feedback, track progress over time, validate assessments, and share best practices across the team. Trainers can add comments and the learner can respond.
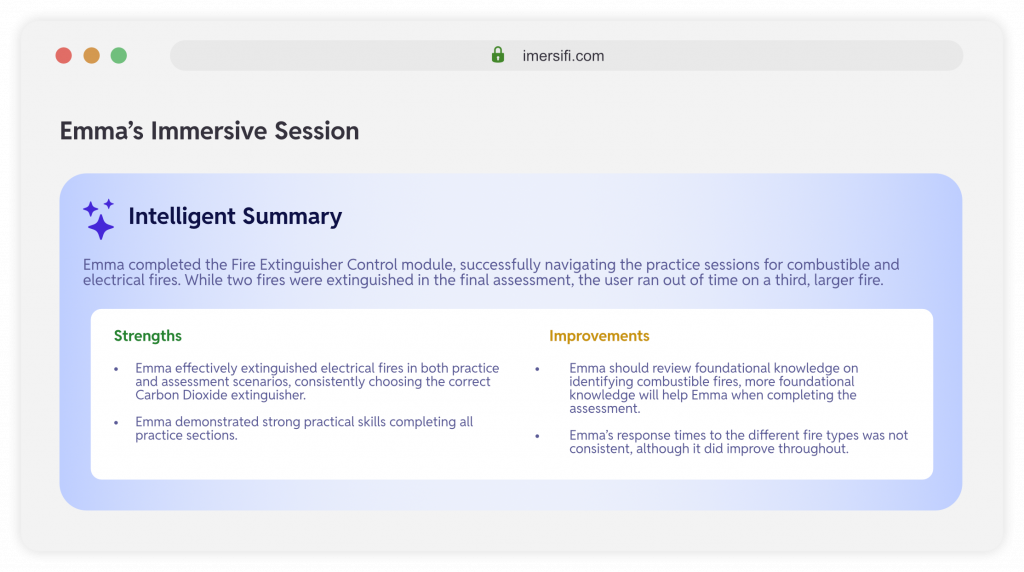
Intelligent insight
AI enhanced, instant, feedback.
Each training session includes an AI-generated summary that provides personalised feedback for the learner. The AI analyses performance across the entire session—identifying strengths, pinpointing mistakes, and offering actionable suggestions for improvement.
This built-in reflection supports deeper learning, self-awareness, and faster skill development without requiring constant trainer intervention.